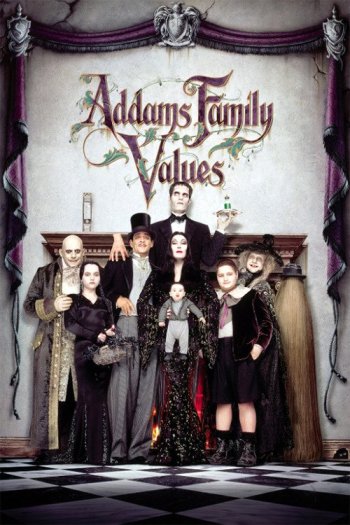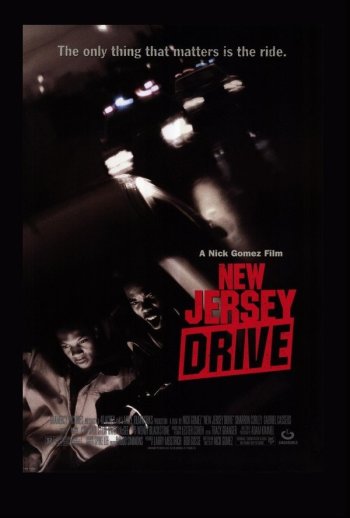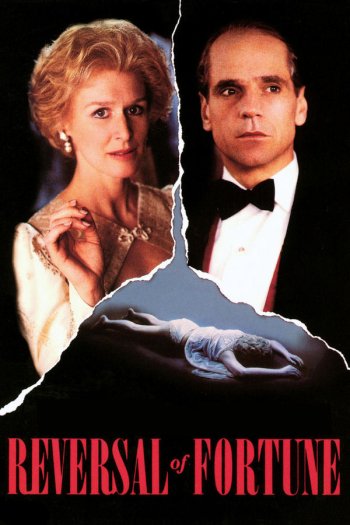
(Source: TMDB)
Christine Baranski
05/02/1952 (73 years old) | Buffalo, USA | Actor | Female
Christine Baranski, an acclaimed actor hailing from Buffalo, New York, has left an indelible mark on both stage and screen. Her illustrious career spans decades, characterized by her exceptional talent and versatility. Baranski's captivating performances in film, television, and theatre, including roles in The Good Wife and Mamma Mia!, have earned her widespread recognition and critical acclaim. Renowned for her impeccable comedic timing and dramatic depth, she's garnered numerous accolades, showcasing her prowess in both drama and comedy. Baranski's enduring presence and dedication to her craft have cemented her as a revered figure in the entertainment industry, captivating audiences with every role she embodies.


